
고정 헤더 영역
상세 컨텐츠
본문
데이터 시각화를 위해 기초 라이브러리 Matplotlib에 대해서 알아보겠습니다.
1. Matplotlib
- 파이썬 기반 시각화 라이브러리
- 한글에 대한 지원이 완벽하지 않음
- pandas와 연동이 용이함
- Matplotlib 공식 홈페이지 https://matplotlib.org
Matplotlib — Visualization with Python
seaborn seaborn is a high level interface for drawing statistical graphics with Matplotlib. It aims to make visualization a central part of exploring and understanding complex datasets. statistical data visualization Cartopy Cartopy is a Python package des
matplotlib.org


이전에 학습했던 numpy 라이브러리의 arange를 활용하여 그래프를 만들어보겠습니다.


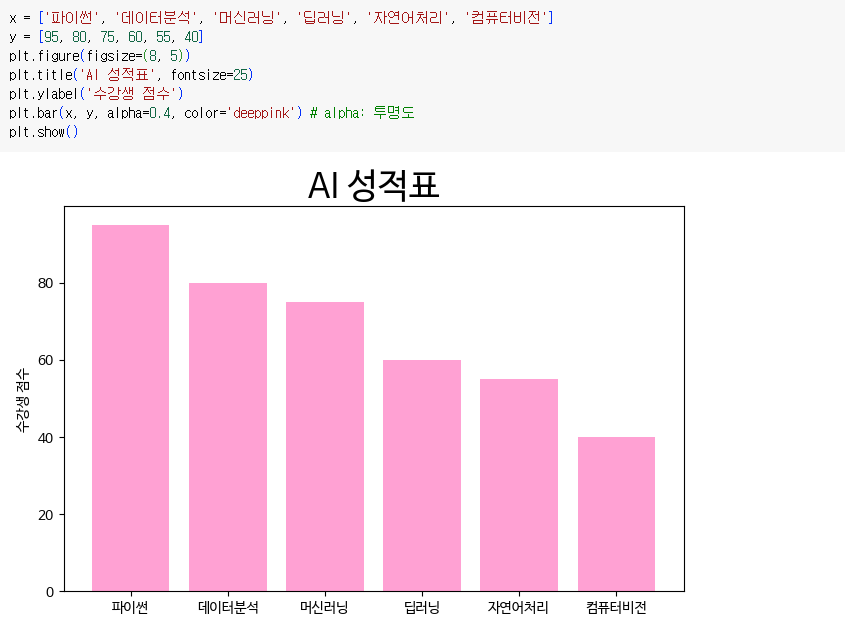
2. 스타일 옵션
Matplotlib 라이브러리 사용시 한글을 입력하면 깨지는 현상이 발생하기 때문에 한글을 사용하기 위해서는 한글 fonts-nanum을 설치해야합니다.

코드 실행 후 런타임 -> 세션 다시 시작 및 실행


x 축의 변수 즉 독립변수의 명칭이 매우 길어서 다른 변수 명칭과 겹치는 경우가 발생하기도 합니다. 이런 경우에는 다음과 같이 코드를 수정할 수 있습니다.


'데이터분석' 카테고리의 다른 글
| 상권별 업종 밀집 통계 데이터 (0) | 2024.05.31 |
|---|---|
| 가상 온라인 쇼핑몰 데이터 (0) | 2024.05.31 |
| 판다스 - 02 (Pandas) (0) | 2024.05.28 |
| 판다스 - 01 (Pandas) (0) | 2024.05.28 |
| 크롤링(Crawling) (0) | 2024.05.27 |


